Chiang Mai Studio & Live Cohorts

Master False Breakout Detection & Structural Chart Reading

Dev Orbit Point trains market analysts and technical chartists to identify bull and bear traps, recognize institutional liquidity sweeps, and build mathematically disciplined risk execution frameworks.

12 Seats Max Cohort Cap
400+ Documented Trap Case Studies
Est. 2019 Chiang Mai Studio
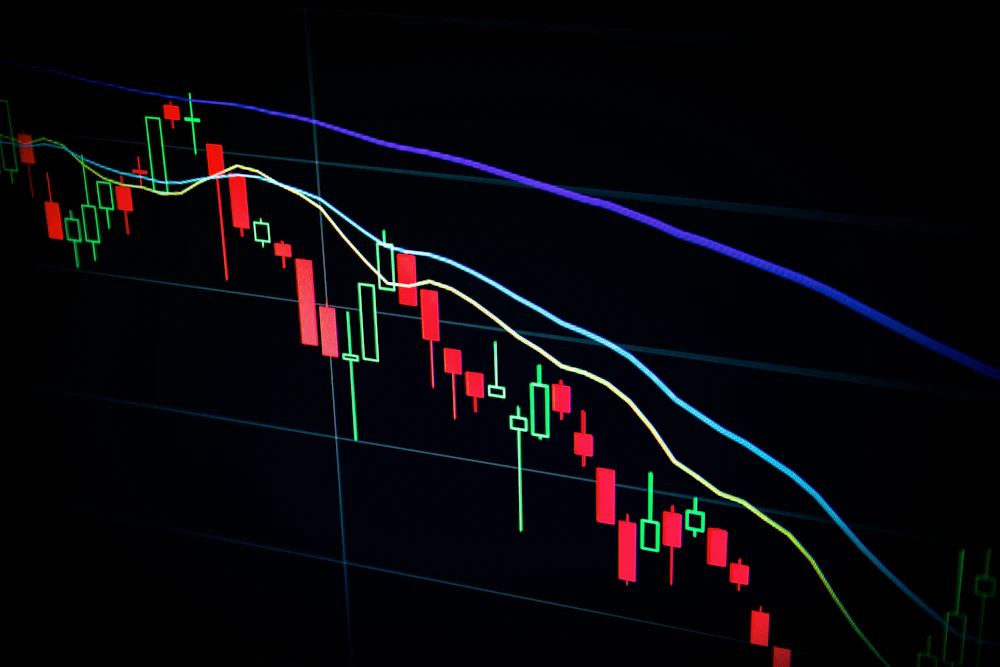
Technical chart analysis workshop at Dev Orbit Point studio
Next Cohort: Registration Open 4-Week False Breakout Masterclass • 12 Seats
Reserve Seat
The Analytical Edge

The Mechanics of Market Traps & Liquidity Extractions

Most chartists lose capital on conventional breakout signals because traditional horizontal levels act as magnets for stop-loss clusters rather than guaranteed directional continuations.

01

Liquidity Engineering

Market makers and aggressive participants push price slightly beyond visible swing highs or support lows to trigger resting stop orders and draw in breakout participants.

02

Volume Absorption

Large counterparties absorb the breakout momentum, resulting in elongated candlestick wicks, delta divergences, and sudden order exhaustion on higher timeframes.

03

Structural Reclaim

Price rotates swiftly back inside the previous consolidation boundary, leaving trapped participants on the wrong side and igniting rapid mean-reversion moves.

04

Disciplined Invalidation

Our students enter confirmed reclaim setups with surgical stop losses placed just beyond the rejection wick, creating 3:1 to 5:1 asymmetric reward-to-risk profiles.

Flagship 4-Week Workshop

False Breakout Detection Lab & Masterclass

An intensive curriculum combining 32 hours of live candlestick dissection, historical pattern forensics, and weekly 1-on-1 personalized trade journal audits. Limited strictly to 12 participants per cohort to ensure deep individual mentoring.

  • Weekly live chart review sessions in our Chiang Mai studio & interactive streaming
  • Permanent access to 400+ curated false breakout chart archives and workbook
  • 60 days of post-cohort access to Saturday morning live chart debrief clinics

Cohort Syllabus Highlights

Week 1: Structural Traps & Liquidity

Mapping resting stop pools and identifying smart money absorption signatures.

Week 2: Wick Rejection & Exhaustion

Pinpointing delta imbalances and 2-bar reversal patterns at major keys.

Week 3: Session Timing & Fakeouts

London open liquidity sweeps and Asian range deviation validation.

Week 4: Risk Sizing & Execution

Structural invalidation points, position scaling, and simulated lab drills.

Structured Curriculum

Technical Analysis Training Offerings

From weekend tactical intensives to comprehensive individual mentorships, our education model is built on deliberate chart practice.

False Breakout Detection Lab & Masterclass
Flagship Program

False Breakout Detection Lab & Masterclass

Our flagship intensive 4-week workshop focused on identifying bull and bear traps, stop-hunt liquidity sweeps, and high-probability reversal confirmation across major market sessions.


  • 4 Weeks (32 Total Training & Lab Hours)
  • Small-Group In-Person Workshop & Live Interactive Chart Clinic
Liquidity Sweeps & Trap Identification Clinic
Weekend Intensive

Liquidity Sweeps & Trap Identification Clinic

An intensive 2-day practical clinic covering order book absorption, engineered liquidity pools, and rapid reversal recognition on intraday timeframes.

  • 2 Days (14 Training Hours)
  • Interactive Weekend Intensive Seminar
Multi-Timeframe Range Architecture Workshop
Core Strategy

Multi-Timeframe Range Architecture Workshop

A deep dive into structural market geometry, equilibrium levels, value area migrations, and multi-timeframe trend alignment.

  • 3 Weeks (18 Total Hours)
  • Hybrid 3-Week Guided Study Group
1-on-1 Private Chart Review & Risk Mentorship
Bespoke Coaching

1-on-1 Private Chart Review & Risk Mentorship

Tailored individual coaching combining rigorous trade journal audits, personalized execution drill design, and live screen-share chart reviews.

  • 8 Weeks (8 Private 90-Minute Sessions + Daily Journal Audits)
  • Private One-on-One Dedicated Mentoring (In-Person or Digital)
Student Outcomes

Feedback from Technical Analysis Cohorts

Hear how analysts and traders refined their execution discipline and eliminated premature breakout losses.

★★★★★

“Before joining the 4-week false breakout lab at Dev Orbit Point, I was constantly getting caught in bull traps at major swing highs. The systematic wick rejection exercises and volume climax profiling completely changed how I read market structure. I now have the discipline to wait for reclaim confirmation instead of impulsively chasing breakouts.”

Tanawat Siriwong
Tanawat Siriwong
False Breakout Detection Lab (Cohort 11) • Bangkok, Thailand
★★★★★

“The trade journal audit was eye-opening. Somchai went through 60 of my past trade setups and demonstrated that 70% of my losses were caused by buying into Asian range exhaustion right before London open reversals. Having a dedicated mentor audit my charts in person in Chiang Mai gave me unmatched clarity.”

Marcus Lindqvist
Marcus Lindqvist
1-on-1 Private Chart Review & Risk Mentorship • Chiang Mai, Thailand
★★★★★

“The 2-day weekend clinic packed more practical technical analysis than months of self-study. The live session replays of double-bottom liquidity sweeps gave me clear rules for placing invalidation points based on structure rather than guessing arbitrary pip stops.”

Preeya Ratanaporn
Preeya Ratanaporn
Liquidity Sweeps & Trap Identification Clinic • Phuket, Thailand
Read All Student Case Studies
Academy Journal

Technical Analysis Guides & Chart Studies

Practical articles from our Chiang Mai instructors covering false breakouts, risk rules, and trade auditing routines.

Frequently Answered

Common Questions About Our Training

What is the primary difference between a true breakout and a false breakout?

A true breakout demonstrates aggressive follow-through volume, price acceptance, and successful structural retests above broken resistance (or below support), turning prior levels into new zones of market interest. A false breakout occurs when price probes beyond a structural level only to sweep resting liquidity, encounter sharp counter-absorption, and quickly rotate back inside the prior trading range.

Where are the training workshops and clinics physically held?

Our in-person cohorts and chart review sessions take place at the Dev Orbit Point Studio located at 98/5 Sam Lan Road, T. Phra Sing, A. Mueang Chiang Mai, Chiang Mai 50200. For international participants, interactive live video broadcasts with real-time screen sharing and lab participation are available for select cohorts.

Do I need prior experience in technical analysis before joining?

Participants should be familiar with basic candlestick charts, support and resistance concepts, and chart navigation. Our programs are designed to advance intermediate chartists into disciplined, structural market analysts who understand liquidity mechanics and risk control.

Does Dev Orbit Point provide trade signals or investment advice?

No. Dev Orbit Point is strictly a technical analysis training academy and chart education studio. We do not provide financial advice, broker services, managed accounts, or automated buy/sell signals. Our sole purpose is teaching structured technical chart reading and risk discipline.

What happens if I miss a live cohort session?

All lecture modules and chart lab breakdowns are recorded in high-definition and made available in your student review library within 12 hours. Furthermore, you can bring any specific questions or chart dilemmas to our weekly Saturday clinic hours.

Join Our Next Cohort

Advance Your Technical Market Literacy

Speak directly with our instructional team in Chiang Mai or reserve your seat for the upcoming 4-Week False Breakout Detection Lab.

Submit Course Inquiry Learn About Our Origin